
By John Sutter
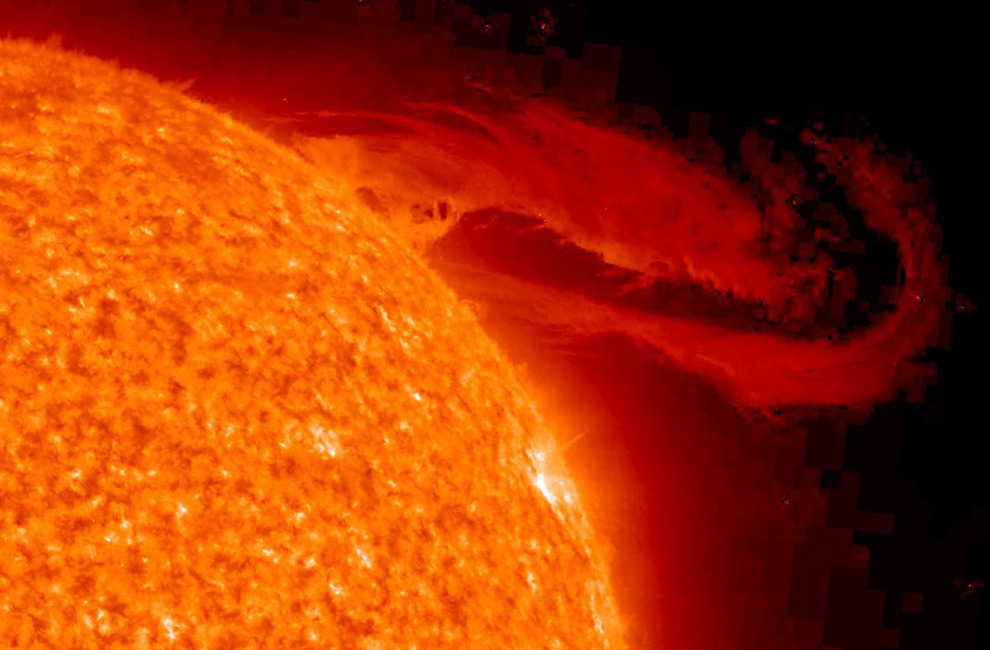
Check out these awesome pictures of the sun, from The Big Picture, on the Boston Globe's Web site. Pretty cool.
Of note is the fact that scientists don't know what the deal is sunspots lately. There appear to be fewer of them now than at any time since early in the 1900s. Some climate change skeptics have posited that the sun spots, instead of human emissions of heat-trapping gases, explain warming temperatures. Here's an NYT article about the uncertainty surrounding that claim. Another period of low solar activity coincided with global cooling and an Ice Age:
Scientists are not sure why this minimum has been especially minimal, and the episode is even playing into the global warming debate. Some wonder if this could be the start of an extended period of solar indolence that would more than offset the warming effect of human-made carbon dioxide emissions. From the middle of the 17th century to the early 18th, a period known as the Maunder Minimum, sunspots were extremely rare, and the reduced activity coincided with lower temperatures in what is known as the Little Ice Age.A University of Michigan scientist I spoke with last week said that linking climate change to sunspots is misleading and irresponsible because the scale of the effects are so different and because sunspot patterns vary wildly over short periods of time. It's clear that heat-trapping gases emitted by our industries are to blame for climate change, he said.


3 comments:
That picture is incredibly cool.
It reminds me of the pics from Hubble.
Sorry, I don't have anything smart to say, as per usual.
That U of Michigan guy is correct. There has been SO much misleading info on blogs and in conservative news outlets this year about sunspots and climate change, and a lot of the info on sunspots is just plain wrong. The climate change skeptics act as if climatologists never considered sunspots effect on weather, but it turns out the sun's irradiance varies only slightly, and it is not even correlated with sunspot activity.
If you plot the average mean temperature variance by decade alongside the average mean sunspot activity, you'll clearly see a correlation. I've plotted this data going back to 1890 and was shocked at how the averages moved in tandem.
Post a Comment